Introducing GrafLens
Whether you operate a production Kubernetes cluster or maintain a homelab sustained by determination and YAML, if Grafana is part of your observability stack, you recognize the frustration of consulting dashboards on a mobile device.
Navigating to a Grafana instance via a mobile browser is an exercise in frustration. You encounter compact text, unresponsive panels, and an interface that was never designed for smaller displays. So I decided to create something better.
GrafLens is a native iOS, iPadOS, and macOS application for browsing your Grafana dashboards, visualizing panels, and monitoring alerts, all directly from your Apple device.
It’s available now on the App Store, and the source is entirely open on GitHub.
Why I Created It
Grafana is a remarkable platform for data visualization, but its mobile experience has always been a notable deficiency. During incident response, away from your workstation, or simply curious about your homelab metrics, there are frequent occasions where rapid access to a dashboard or alert status is essential. No native mobile client existed that addressed this properly, so I decided to create one.
GrafLens was designed from the start as a native SwiftUI application. It is not a web wrapper or a progressive web app. It is a genuine native iOS experience, constructed to integrate naturally with the Apple ecosystem.
Features
Multi-Server Connections
GrafLens allows you to configure connections to multiple Grafana instances. Whether you run a personal homelab server, a corporate production environment, or both, each connection is stored securely with its service account token in the device Keychain.
Dashboard Browser

Browse all of your Grafana dashboards, organized by folder. Integrated search makes it simple to locate the exact dashboard you need, even across installations with hundreds of dashboards.
Panel Viewer
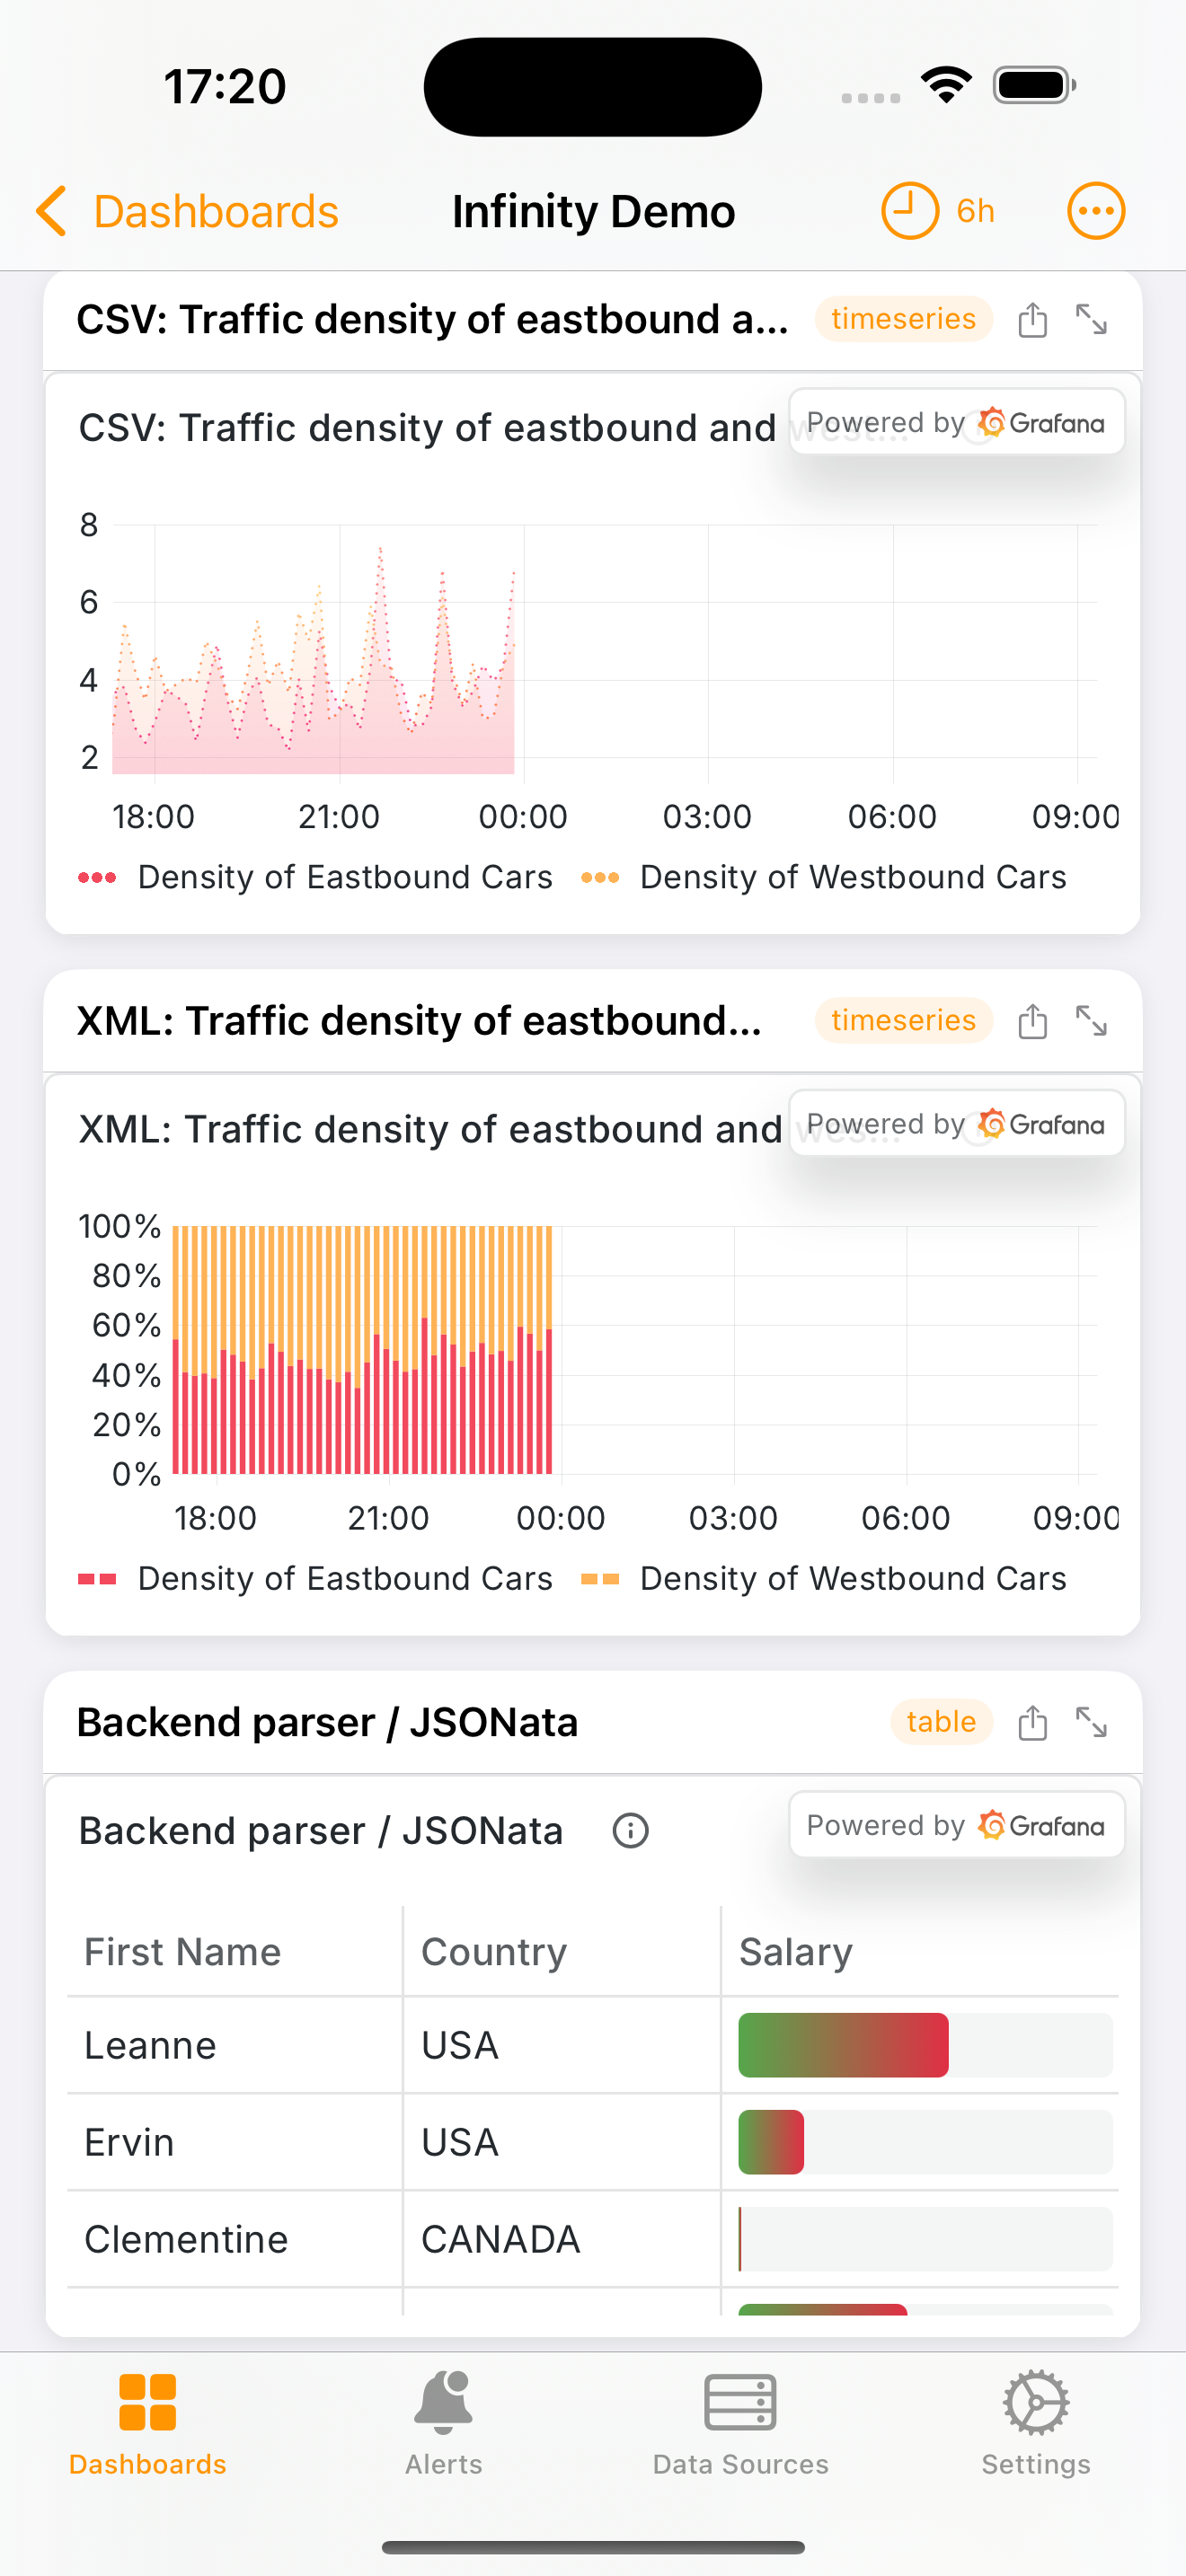
Panels are rendered with fidelity, supporting configurable time range selection from five-minute intervals to thirty days. GrafLens renders compatible panel types (Stat, Gauge, TimeSeries, BarChart) natively via SwiftUI Charts and uses embedded web views for more complex visualizations.
You can tap any panel to expand it to full screen for detailed inspection.
iPad Experience
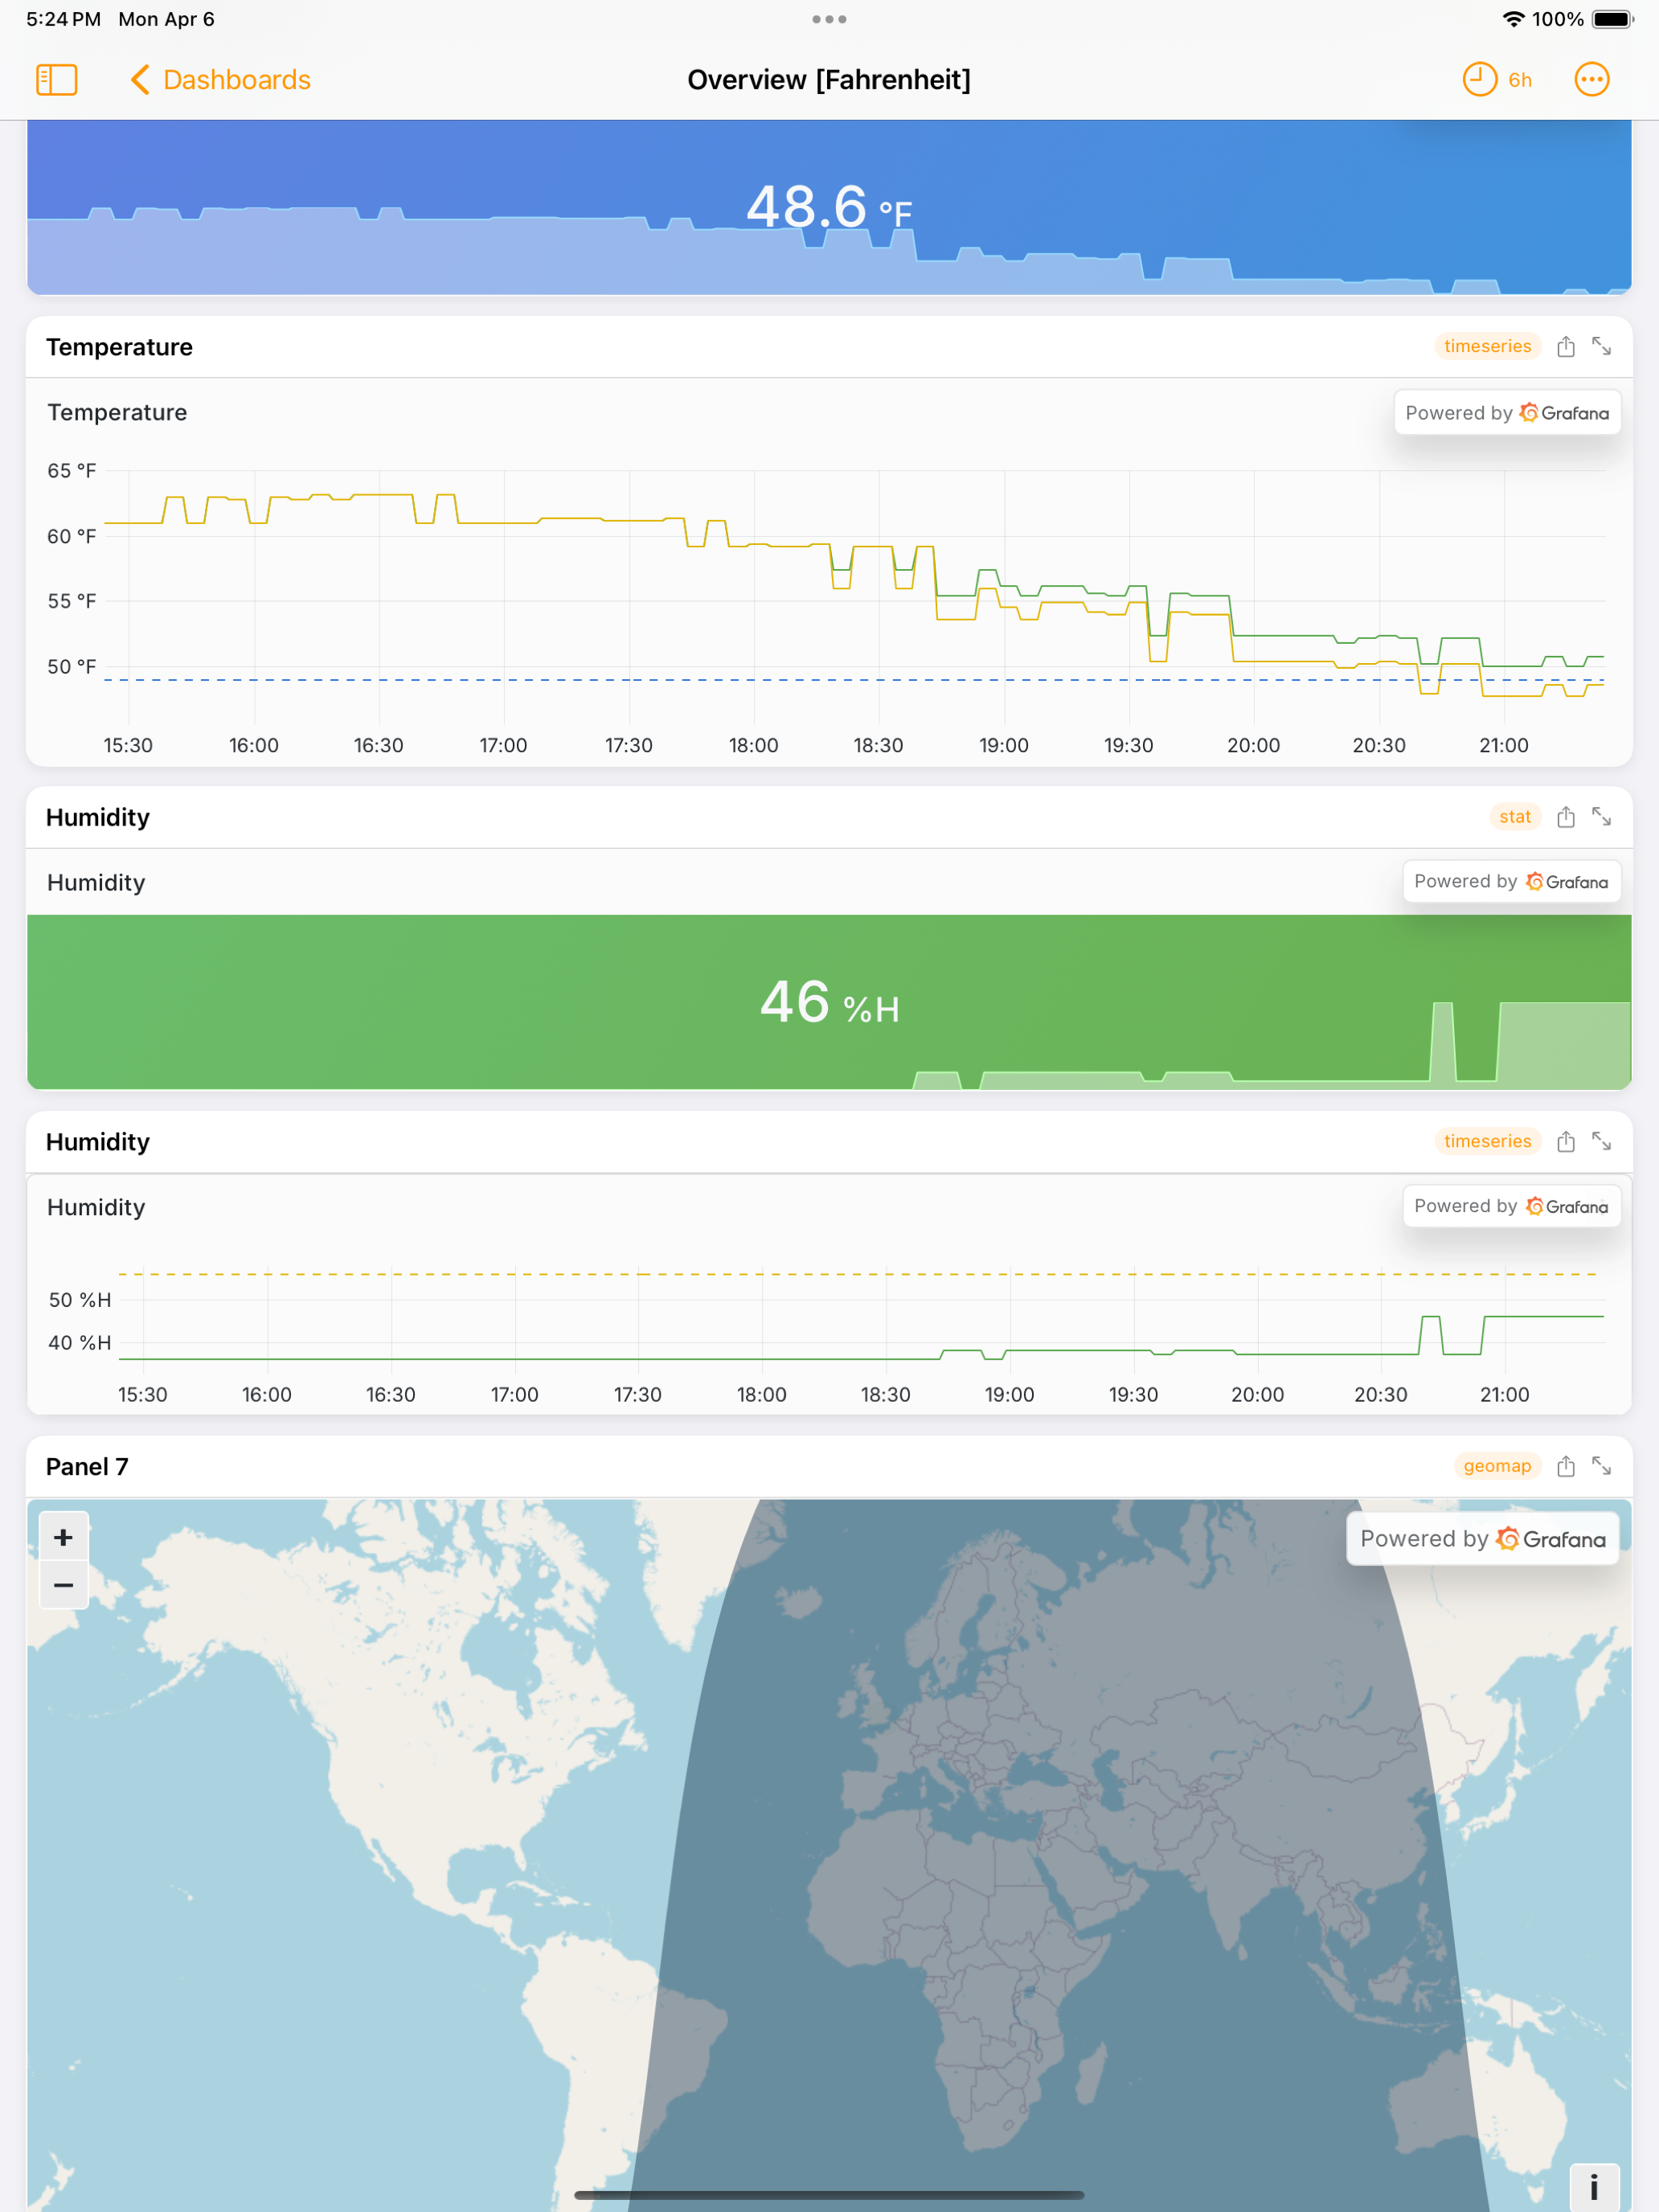
On iPad, GrafLens takes advantage of the additional display area to present panels and dashboards with considerably more clarity and detail.
Alert Monitoring
You can view your Grafana alert rules and active firing alerts directly in the app. GrafLens also supports alert silences and annotation creation, so you can manage your alerting without requiring a desktop browser.
Data Sources
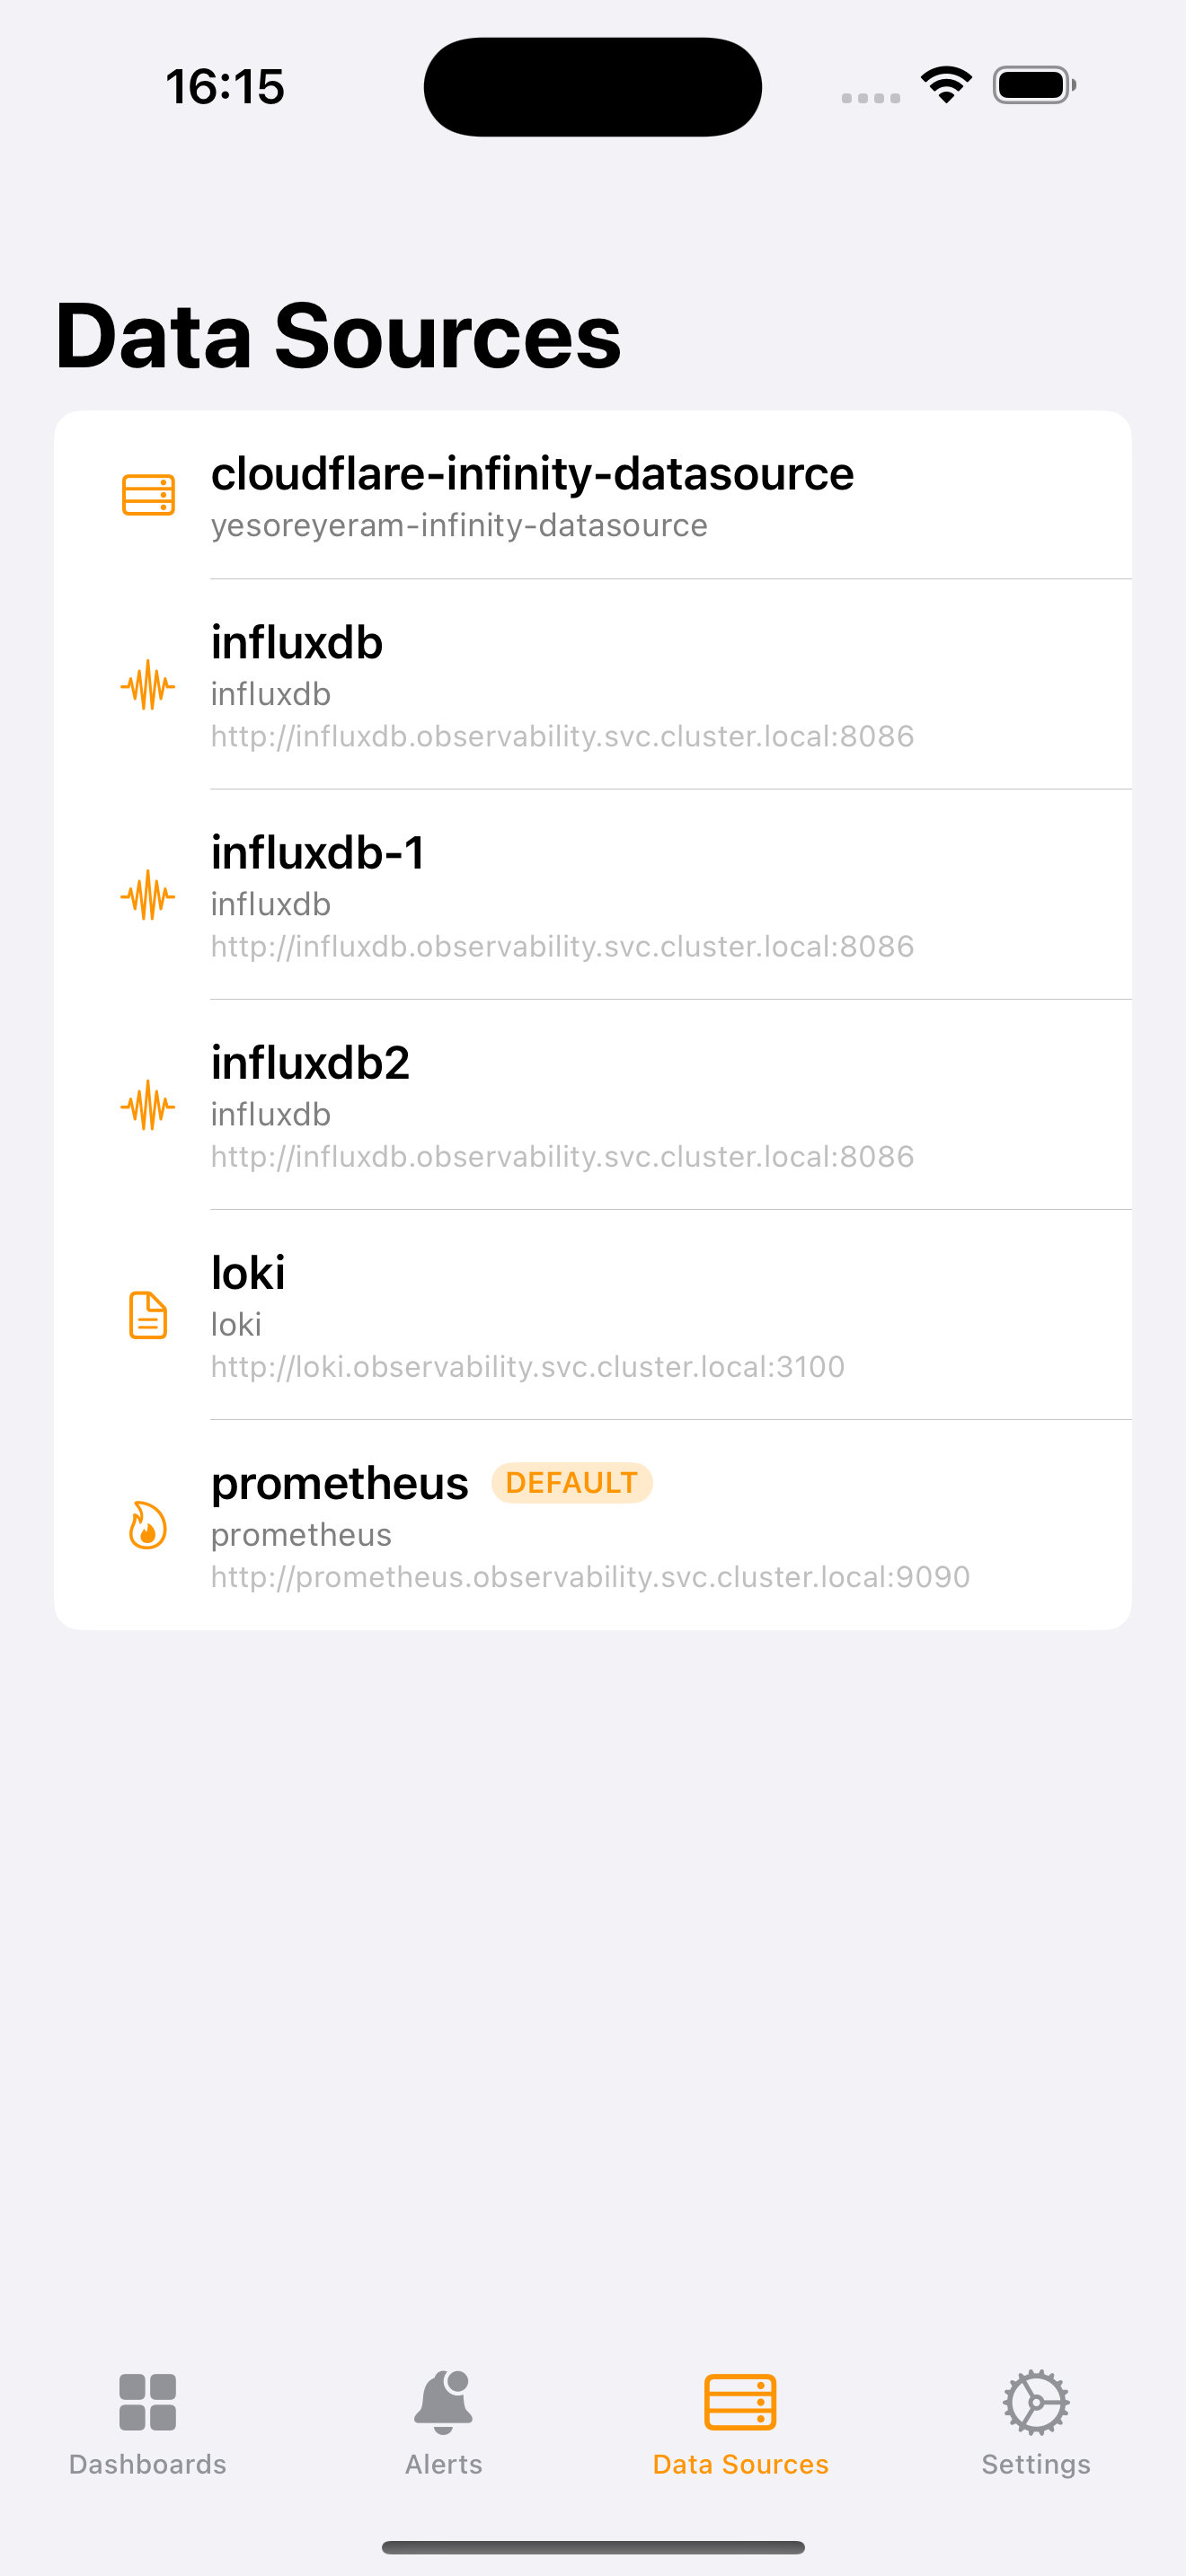
You can inspect all configured data sources across your Grafana instance at a glance: Prometheus, InfluxDB, Loki, and more. This view is particularly useful for rapid verification of data source connectivity and configuration.
Additional Features
- OIDC/OAuth Authentication: Authenticate via Authentik, Okta, or any compliant OIDC provider for secure panel rendering
- Home Screen Widget: The widget extension displays live panel snapshots on your home screen via App Group integration
- Spotlight Integration: Dashboards are indexed for discovery directly from iOS Spotlight
- Dashboard Snapshots & Playlists: View and manage dashboard snapshots and playlist configurations
Configuration
Connecting to your Grafana instance is straightforward:
- Generate a Service Account Token in your Grafana instance (Administration > Service Accounts > Add Service Account)
- Open GrafLens and navigate to Settings
- Enter your Grafana URL and the service account token
- Connect, and your dashboards, alerts, and data sources populate immediately
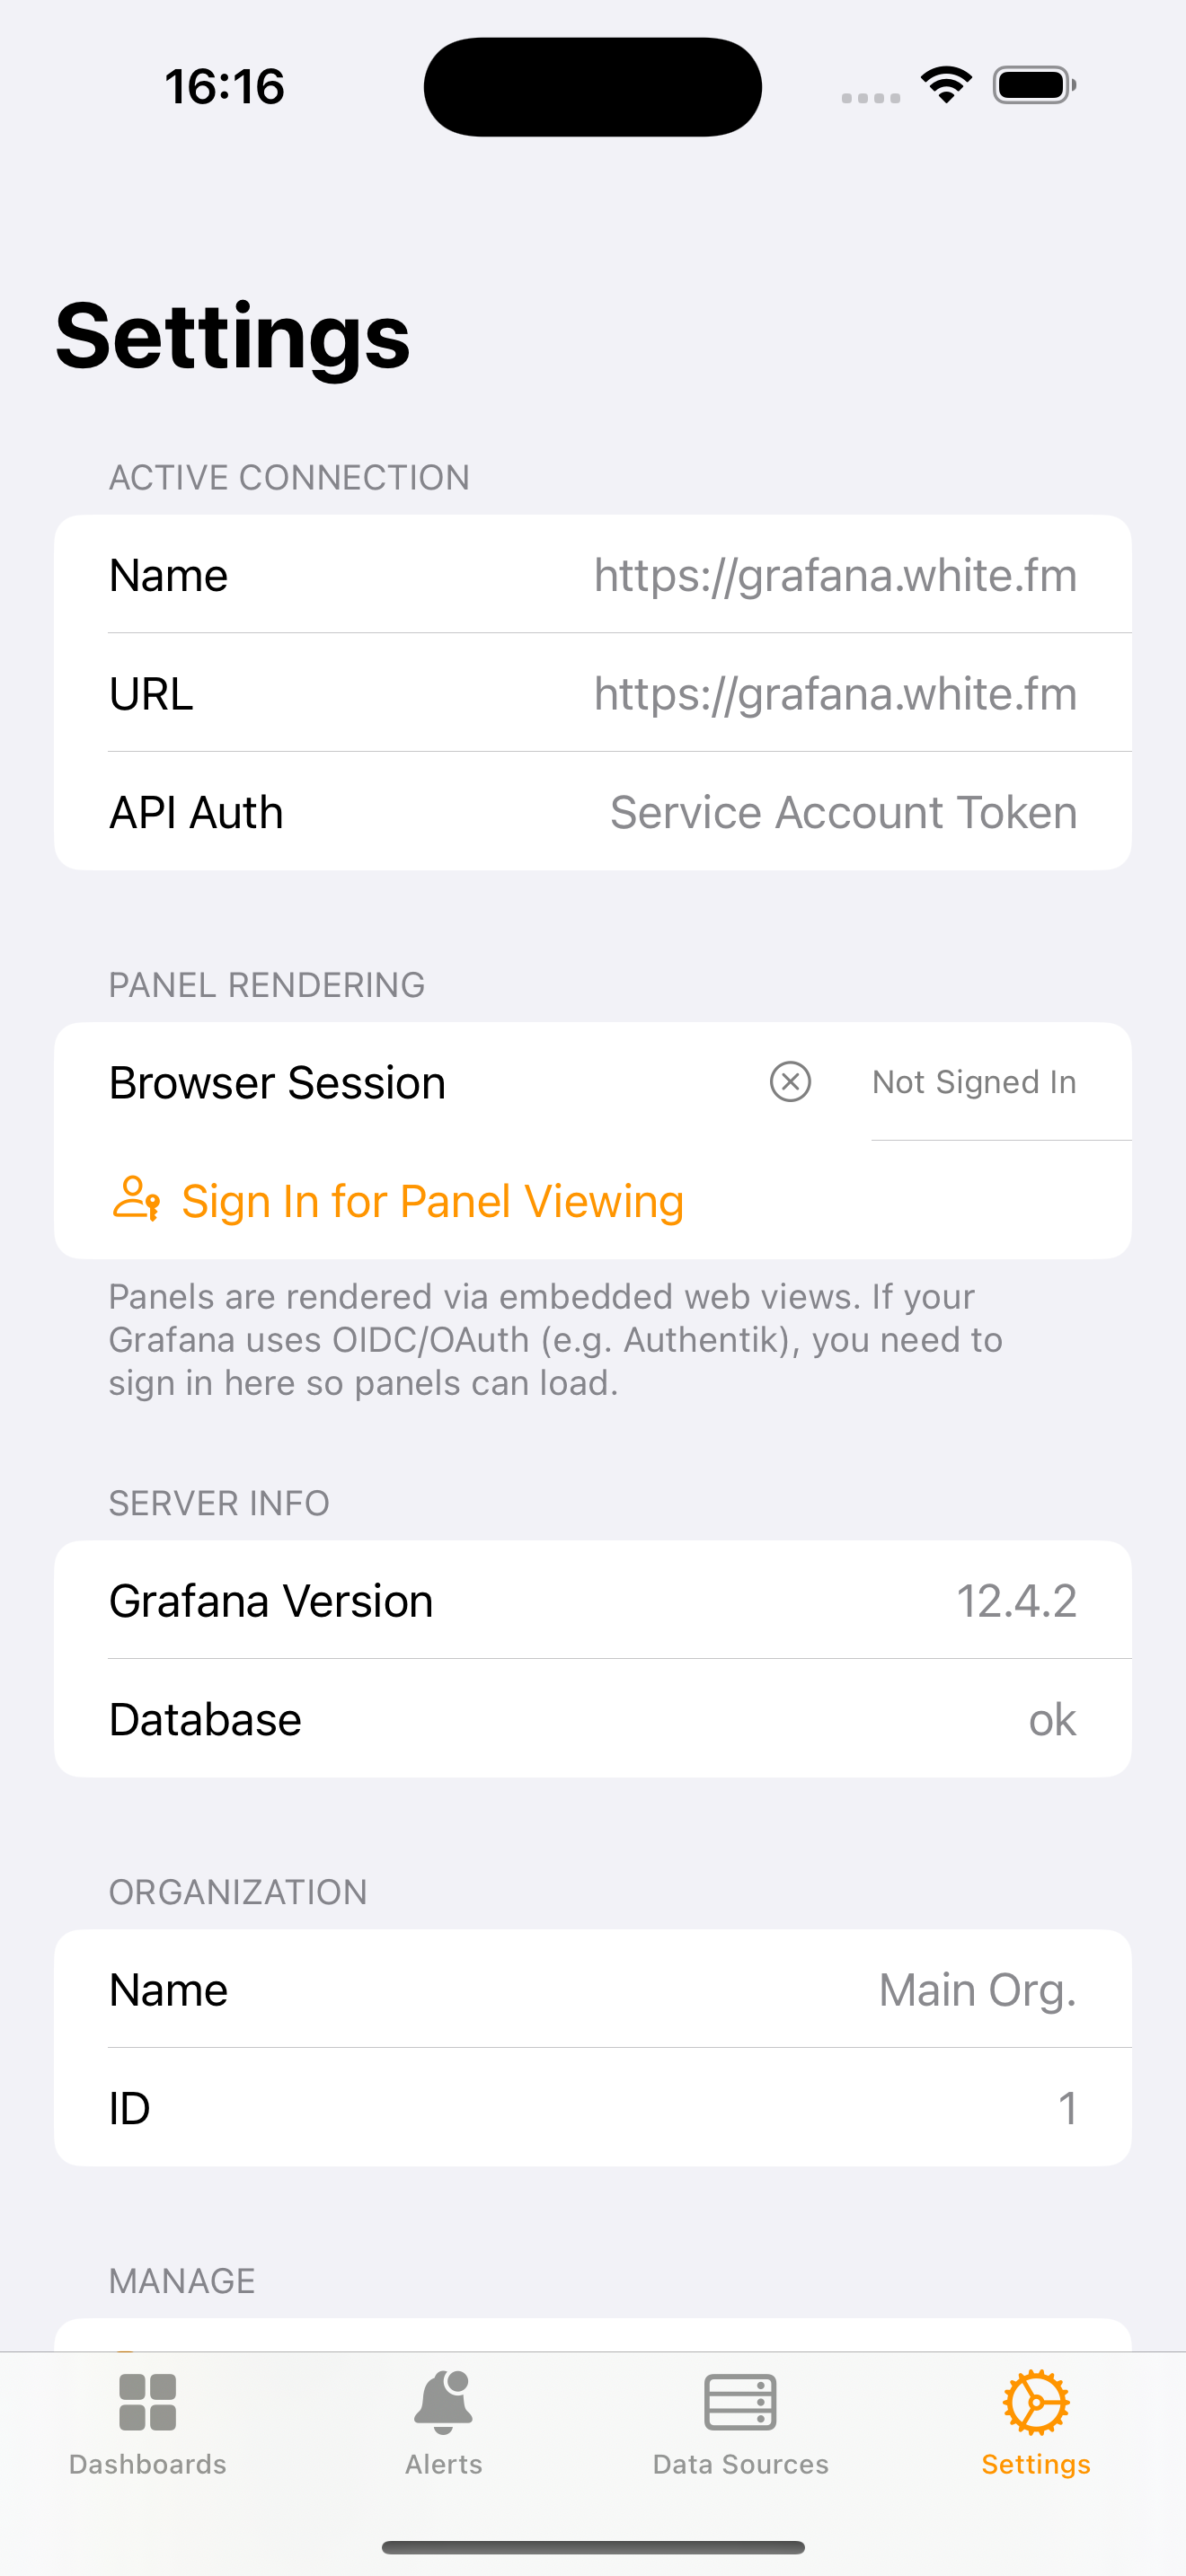
For instances protected by OIDC/OAuth, GrafLens provides an integrated browser-based authentication flow, so you can authenticate via your identity provider without leaving the app.
Open Source
GrafLens is distributed under the MIT license. The complete source code, including the SwiftUI application, widget extension, and all native chart rendering, is available on GitHub:
Contributions are welcome. Whether you want to report a bug, suggest an improvement, or submit a pull request, the repository is open to community participation.
Availability
GrafLens is free on the App Store for iPhone, iPad, and Mac (via Catalyst). It contains no advertisements and collects no data. An optional in-app tip jar exists for those who wish to support continued development.
If you use Grafana in any capacity, whether production infrastructure, homelab, or anything in between, I hope you find GrafLens to be a valuable companion. It has already improved my own workflow, and I expect it will improve yours as well.
As always, if you have any questions, feel free to start a Discussion on GitHub, submit a GitHub PR to recommend changes to the application, or reach out to me directly at [email protected].
Thanks for reading!
Robert