Introduction
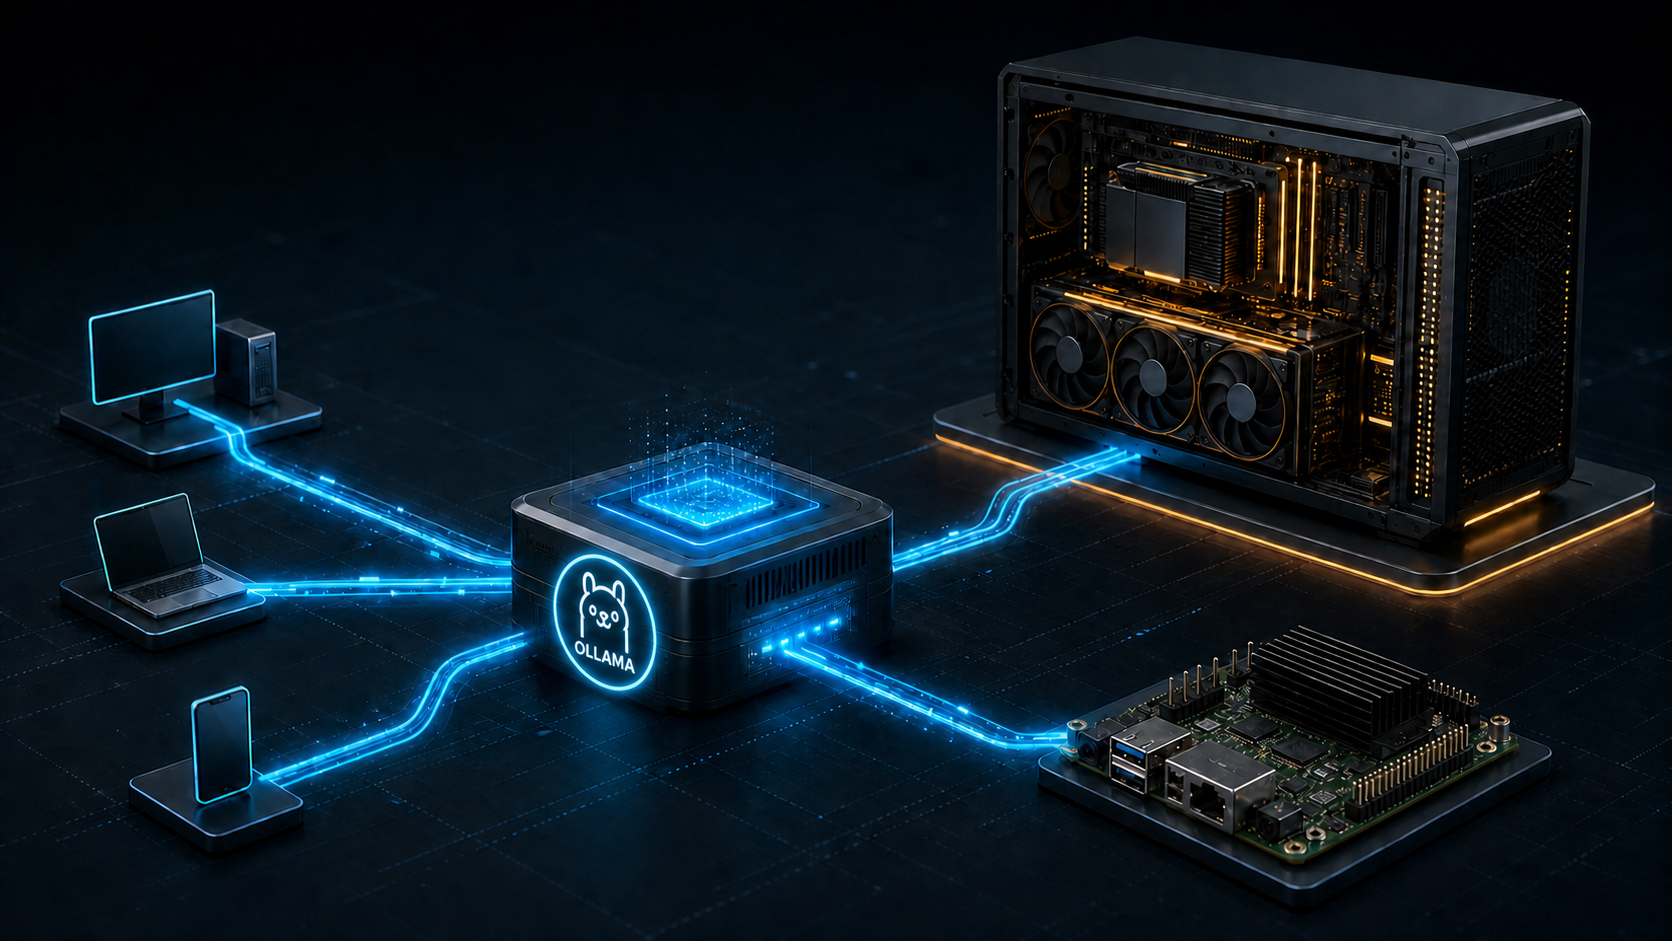
Nine namespaces in my cluster send work to a local language model. The SDR research stack tags transcriptions, the politics dashboard summarises feeds, the congressional-trade tracker prepares daily summaries, and several agents submit work throughout the day. They all call one stable hostname on port 11434.
Behind it are two very different Ollama deployments. The primary is an RTX 5090 in a desktop tower that I deliberately power down at intervals. The fallback is an NVIDIA GB10 Spark board, where CPU and GPU share memory and GPU allocations count against the pod’s memory limit. The repository also contains a CPU-only manifest, although the active Kustomization excludes it. The Spark is the backend that remains when the tower is dark.
The NGINX file is short. Making it dependable was not. Memory accounting, a deliberately intermittent node, and the behaviour of failed requests took the real work.
The Router
Here is the relevant NGINX configuration:
upstream ollama_backends {
  server ollama-5090.ai-stack.svc.cluster.local:11434 max_fails=0;
  server ollama.ai-stack.svc.cluster.local:11434 backup max_fails=0;
}

server {
  listen 11434;

  location / {
    proxy_pass         http://ollama_backends;
    proxy_next_upstream error timeout http_502 http_503 http_504;
    proxy_next_upstream_tries 2;
  }
}
Two settings control the behaviour that matters. max_fails=0 turns off NGINX’s passive failure accounting. Under the default rules, one failed request inside fail_timeout can mark a server unavailable for that interval. That is a poor fit when I have intentionally turned the primary host off and expect it to return later.
proxy_next_upstream permits an individual request to try the next server after an error, timeout, 502, 503, or 504. proxy_next_upstream_tries 2 limits the trip to the two configured backends. An application-level 500 is absent from that list, which means it does not fail over.
backup sends traffic to the Spark after the primary becomes unavailable. The router operates as priority failover. The 5090 does the normal work because it is faster. The Spark preserves service during an outage or a planned power-down.
The router ConfigMap mounts through subPath. Kubernetes does not refresh a subPath mount when the ConfigMap changes, and NGINX does not reload it by itself. A router configuration change therefore needs a pod restart. In this deployment, I delete the router pod and let Kubernetes recreate it.
The Spark’s Memory Model
The Spark has unified memory shared by the CPU and integrated GPU. GPU-backed allocations land in the pod’s memory cgroup, not in a separate VRAM budget. An 80Gi limit can kill Ollama while a discrete-GPU mental model suggests that graphics memory remains.
The NVIDIA device plugin adds another constraint. Each GPU node advertises four time-sliced nvidia.com/gpu replicas. A request for nvidia.com/gpu: 1 gets shared access to the physical device. It does not reserve a quarter of its VRAM or compute time. CUDA workloads are multiplexed, and they can contend for the same memory.
The 5090 stays primary because it is faster and its Ollama deployment limits itself to one parallel request and one loaded model. The Spark is the fallback because unified memory and its higher configured service concurrency make contention more expensive there.
I first responded to OOMKills by lowering OLLAMA_NUM_PARALLEL. It reduced memory use and throughput together. Context length was the larger multiplier. Ollama’s memory requirement grows with parallel requests and context length because every active sequence extends the key-value cache.
Setting OLLAMA_CONTEXT_LENGTH=16384 stopped the OOMKills for this workload. That still left room for OLLAMA_NUM_PARALLEL=4 and OLLAMA_MAX_LOADED_MODELS=3 within the observed 80Gi limit. Check context and parallel sequences together when an inference pod dies. Concurrency is only one part of the calculation.
The Intermittent Primary
The 5090 lives in a desktop with an intermittent power state. Its Kubernetes node is therefore transient, and every pod pinned exclusively to it inherits that fact.
Those pods need tolerations for node.kubernetes.io/not-ready:NoExecute and node.kubernetes.io/unreachable:NoExecute. Without one, the Taint Manager evicts the pod when the node receives a NoExecute taint. My deployment tolerates both for 30 seconds. When that window expires, a pod pinned to the absent machine remains Pending until the node returns.
This node uses NetworkManager, while much of the rest of the fleet uses netplan. I learned the distinction through an ImagePullBackOff whose useful line was lookup ... 127.0.0.53 timeout. The node had kept its local stub resolver instead of the LAN resolvers. I set DNS with nmcli and disabled the DHCP-supplied automatic DNS configuration.
Priority Classes
The manifests define separate priority classes for GPU workloads and the optional CPU fallback:
apiVersion: scheduling.k8s.io/v1
kind: PriorityClass
metadata:
  name: high-priority
value: 1000
---
apiVersion: scheduling.k8s.io/v1
kind: PriorityClass
metadata:
  name: low-priority
value: 500
The active GPU deployments use high-priority. The CPU-only manifest uses low-priority, though it is commented out in the current Kustomization. Enabling it would add a lower-priority fallback.
Priority influences scheduling and preemption. It cannot produce a suitable node from nowhere. Keeping the fallback lower means Kubernetes can evict it before it displaces the primary GPU workload under pressure. Equal priorities erase that order and can let the fallback consume the capacity intended for the faster service.
Observability
An exporter polls both Ollama services at /api/version, /api/ps, and /api/tags, then publishes Prometheus metrics with an instance label. The Grafana dashboard uses that label to show health, loaded models, model inventory, queries, and API latency for ollama and ollama-5090 separately.
The first panel I check tells me which backend is healthy. A report that an assistant is slow or suddenly producing weaker answers can mean the 5090 is down and traffic has moved to the arm64 backend. That answer comes before latency charts.
Provisioned dashboards have a quieter failure mode. A dashboard that refers to a \${DS} datasource variable whose current value is empty shows No data even when Prometheus has metrics. The current dashboard uses the Prometheus datasource UID directly and defines no datasource variable.
Security Notes
The router has no application-level authentication. NetworkPolicy forms part of the boundary, yet policies inside a namespace are additive. The consumer policy allows the listed namespaces to reach port 11434, and other policies also allow traffic from ai-stack, kube-system, authentik, and uptime-kuma. A namespace absent from the consumer list may still reach the router when another applicable policy permits it.
Prompt content crosses namespaces. Several consumers send scraped articles or radio transcriptions to the shared endpoint. The router logs body=$request_body, which writes request bodies to NGINX logs. Those logs are sensitive material. Their retention and access controls need the same attention as the prompts themselves.
The model-serving endpoint does not execute tools. Tool access and side effects belong to the calling application, which leaves every consumer responsible for its prompt handling, model output, and downstream actions.
A shared endpoint creates a shared failure domain. When both backends are unavailable, all nine consumer namespaces can degrade together. The politics dashboard currently reports a generic AI Error, which does not distinguish backend unavailability from an application or model failure. I still need to repair that.
Wrapping Up
The router is a small NGINX configuration. The backends supply the interesting failure modes: unified memory that behaves unlike discrete VRAM, a node I mean to take offline, and a fallback whose lower priority makes it useful under pressure.
Mixed inference hardware rewards attention to memory limits, node lifecycle, and failed-request semantics. The proxy is the easy part.
Related Posts
- Hermes: Encrypted Conversation, Deliberate Authority — an agent that treats this endpoint as one interchangeable model route.
- Turning an RSS Reader Into an Intelligence Pipeline — a batch consumer that hammers the endpoint on a schedule.
- Politics Dashboard: A Self-Hosted, AI-Summarized News & X Feed Reader — an earlier consumer, summarizing feeds through the same backend.
- Always-On SDR: Building a Multi-Band Radio Intelligence Platform on Kubernetes — Whisper and Ollama sharing the same cluster GPUs.
Questions or corrections are welcome. Start a Discussion on GitHub, submit a GitHub PR, or email me at [email protected].
Robert